


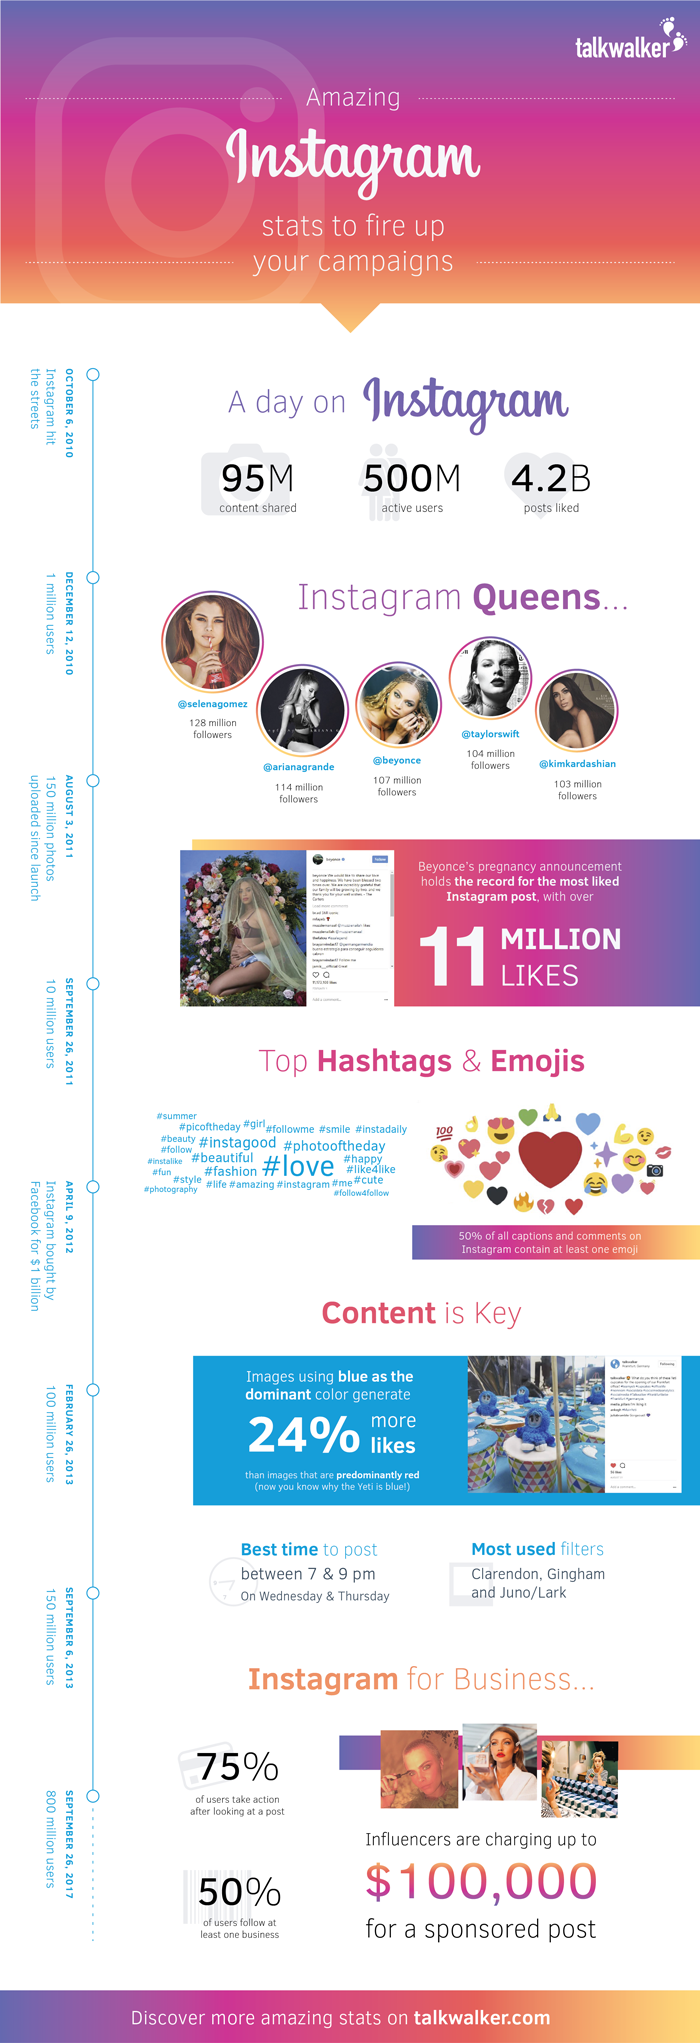
Let’s start with the timeline...
- October 6, 2010 - Instagram hit the streets.
- December 12, 2010 - Instagram racks up 1 million users - hot diggity!
- August 3, 2011 - 150 million photos uploaded since launch.
- September 26, 2011 - Instagram rockets to 10 million users - from 1M to 10M in under a year, just, WOW!
- April 9, 2012 Instagram bought by Facebook for $1 billion - a marriage made in social media heaven.
- February 26, 2013 - hits 100 million users.
- September 6, 2013 - celebrates 150 million users.
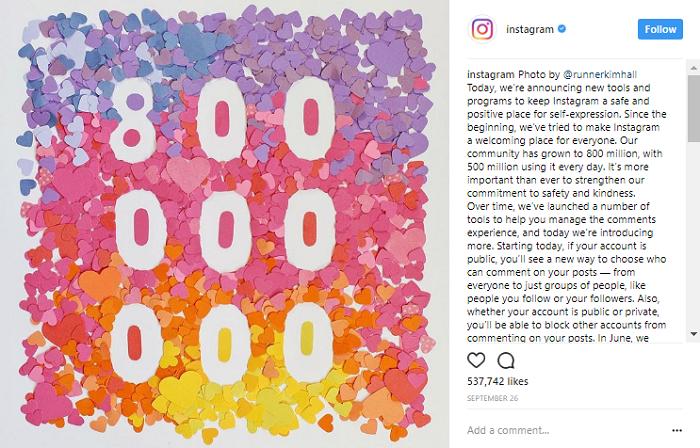
- September 26, 2017 - Instagram community goes through the roof with 800 million users, 500 million daily active users - that's huge.
These Instagram statistics prove the value of Instagram when it comes to targeting consumers and increasing brand awareness - it just works. Brands are in a frenzy, looking for ways to make their products Instagrammable.
Oh yes, it's a real thing, it's visual communication - take a look.
If you're working on or planning an Instagram marketing campaign, you'll want to measure the impact, check your results, share with your team. Take a free demo of our platform - it can measure, check, and share. It's great for marketers, PR professionals, small business owners, and corporate communication officers.
Analyze your brand’s performance on social. Try it now!
First up, our cracking designer has created another awesome infographic. Take a look - Instagrammable, or what?!! Keep scrolling for the full list of 50 amazing Instagram stats.
If you're crazy for stats - there're 80 more at the bottom of this post.
Instagram stats – demographics
- 59% of Internet users between 18-29 years old use Instagram, with 33% of Internet users between 30 and 49.
- Gender is 50/50 on Instagram, however, female Internet users are 38% more likely to use Instagram compared to men at 26%.
- 80% of Instagram users live outside the US.
- In 2015, 77.6 million users were from the US.
- It’s expected that the number of US users will exceed 100 million by 2018.
- 32% of teenagers consider Instagram to be the most important social network - are they right?
- There are 250 million daily users of Instagram stories.
- 32% of Instagram users attended college - not sure that this is hugely important, but included anyway.
Instagram stats – users
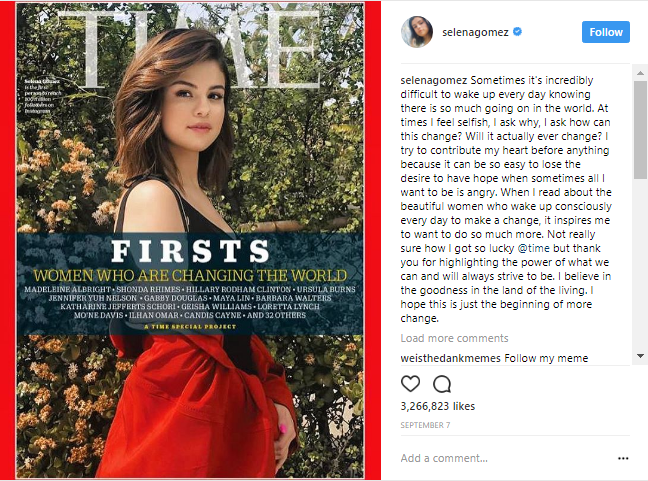
- Selena Gomez leads with 128 million followers on Instagram, that’s more than 20% of Instagram’s entire user base.
- Bringing up the rear are Ariana Grande with 115M, Beyoncé with 107M, Taylor Swift and Mrs West with 104M each - counts are correct at time of publishing, but they fluctuate.
- Beyonce’s pregnancy announcement holds the record for the most liked Instagram post, with over 11 million likes - fertile!

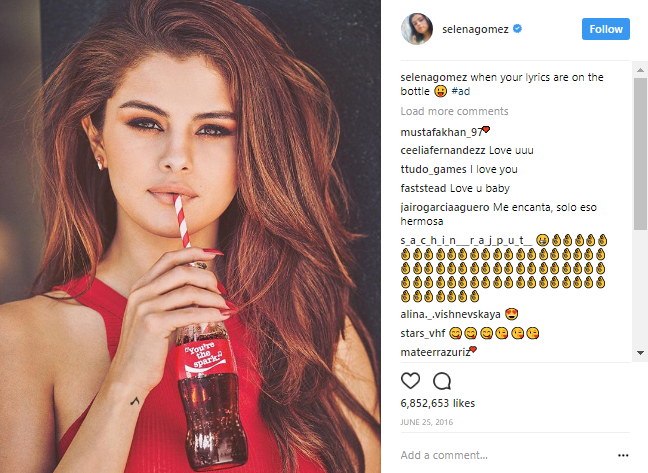
- Before Beyoncé exposed her bump, the most liked post was a sponsored one of Selena Gomez drinking Coca-Cola, with 6.5 million likes and 275,000 comments.
- Fashionistas check Instagram every day, that's 15 times per day, and on average, follow 353 accounts.
- Last year, Instagram reached 1 billion installs on Google Play.
- Average monthly follower growth for Instagram users is 16%.
- 95 million photos and videos are shared on Instagram per day.
- With so many photos shared, it ain't no surprise that users miss 70% of their feeds.
- Group messages with Instagram Direct can include up to 15 people.
- Users like 4.2 billion posts daily.
- You can have 5 Instagram accounts.
Instagram stats – business
- There are 8 million registered businesses using Instagram.
- Big name brands post on average, 4.9 times per week.
- Instagram has 2 million advertisers, that’s a 900% growth since the beginning of 2016 - WOW, WOW, WOW!
- Instagram posted its first sponsored post to US users in November 2013. US brand, Michael Kors, received a whole bunch of negative comments - hey, no one likes ads - but the brand gained nearly 34,000 new followers in the 18 hours are posting.

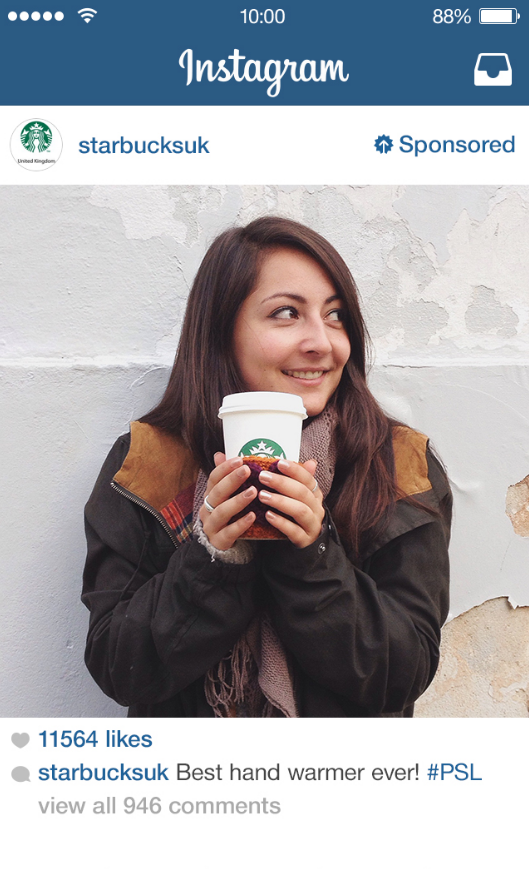
- The first sponsored posts to UK users was in September 2014 with an ad from Starbucks. Again, there were negative comments. But, this initial reaction has not put brands off - I doubt that the 15M+ followers of Starbucks are there just to complain.
- Over 50% businesses on Instagram have produced a story.
- 50% of Instagram users follow at least one business.
- 60% of users state that they’ve learned about a product or service on Instagram.
- 75% of users take action after looking at an Instagram post.
- 60% of top brands on Instagram use the same filter for every post
- In 2017, 70.7% of US companies will use Instagram for marketing, edging out Twitter for the first time - oooh, competition, love it.
- Instagram influencers are charging up to $100,000 for a sponsored post - $$$$$$$$.
- Instagram’s global mobile ad revenues will reach $2.81 billion in 2017 - even more, $$$$$$$$.
Instagram stats – content
- Average engagement rate for all Instagram posts is 1.1%.
- Posts with hashtags resulted in a 70.14% increase in likes compared to those without.
- Posts during out of hours get more engagement, with 7 to 9pm being the optimum time for posting (depending on your time zone).
- Wednesday and Thursday posts can bring the most engagement, with Sunday bringing the least.
- More than 40 billion photos have been uploaded to Instagram.
- Images featuring blue as the dominant color generate 24% more likes than images that are predominantly red.

Just saying!
- Photos with faces get 38% more likes than photos without, they’re also 32% more likely to attract comments.

Does the Yeti face count?
- When Instagram launched videos, 5 million were uploaded in the first 24 hours.
- Users look at video for 5 times longer than static content, when using Instagram on mobile.
- Instagram videos get 2 times the engagement of photos compared to other social media platforms.
- Top 10 hashtags on Instagram: #love #instagood #photooftheday #tbt #beautiful #cute #me #happy #fashion #followme.
- Pizza is the most hashtagged food. Afters include sushi, steak, burgers, bacon, tacos, donuts…
- The most shared emoji is the red heart, with 79% more than the next most popular symbol - smiling face with heart eyes.
- 50% of all captions and comments on Instagram contain at least one emoji.
- 92% of Instagram posts are photos - admittedly, not one of the most earth shattering Instagram statistics.
- The most popular filters are Clarendon, Gingham, and Juno/Lark.
These Instagram stats are awesome. Use them to inspire your Instagram marketing campaigns. If you're looking for real-time, in-depth insights and analytics about your campaigns, audience, brand, and competitors - Talkwalker is just a click away. Sign up for a free demo now, and we'll show you how it will help.
Of all the Instagram stats, which is your favorite?
If you want some more, check 80 more stats at the bottom!

You may also like: 40 amazing Twitter stats to inspire your social strategy & 40 amazing Facebook stats to inspire your campaigns
